LEAN Tools
- 5S
Workplace organization - KANBAN
Material management - LEAN OFFICE
Optimization in the office - DESIGN THINKING
A way of thinking - LAYOUT
Internal logistics - SMED
Rapid changeover - SOP
Standardization of work - TPM
Total Productive Maintenance - TWI
Training Within Industry - KPI
Visual Management - VSM
Value Stream Mapping
Find out more from the experts
Talk to Lean Idea
+48 607 86 49 85
VSM
VSM - Value Stream Mapping
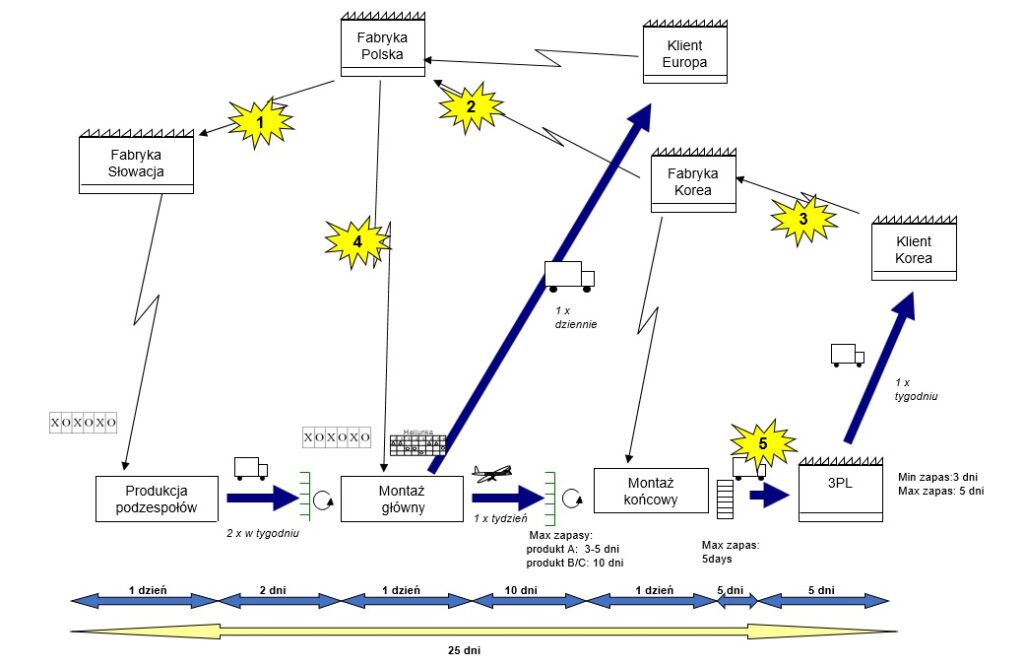
Value Stream Mapping (VSM) is an image-based visualization technique used to identify problems and losses in a process under examination.
VSM is used as a tool for:
- communication,
- strategic planning,
- management change.
The mapping process consists of three steps that enable a transition from the current state to the ideal state:
Creating a map that shows the current status of an area
Creating a map that shows the future status of an area
Defining a change plan that outlines the steps necessary to implement in order to achieve the ideal state

How to perform process mapping?
- Select the area you want to analyze. Define the beginning and end of the process. Determine the product, group of products, or service that interests you.
- Create an interdisciplinary team. Invite all process participants. A well-selected team will help to better identify areas for improvement.
- Answer the question: why does this process exist?
- Create a process map:
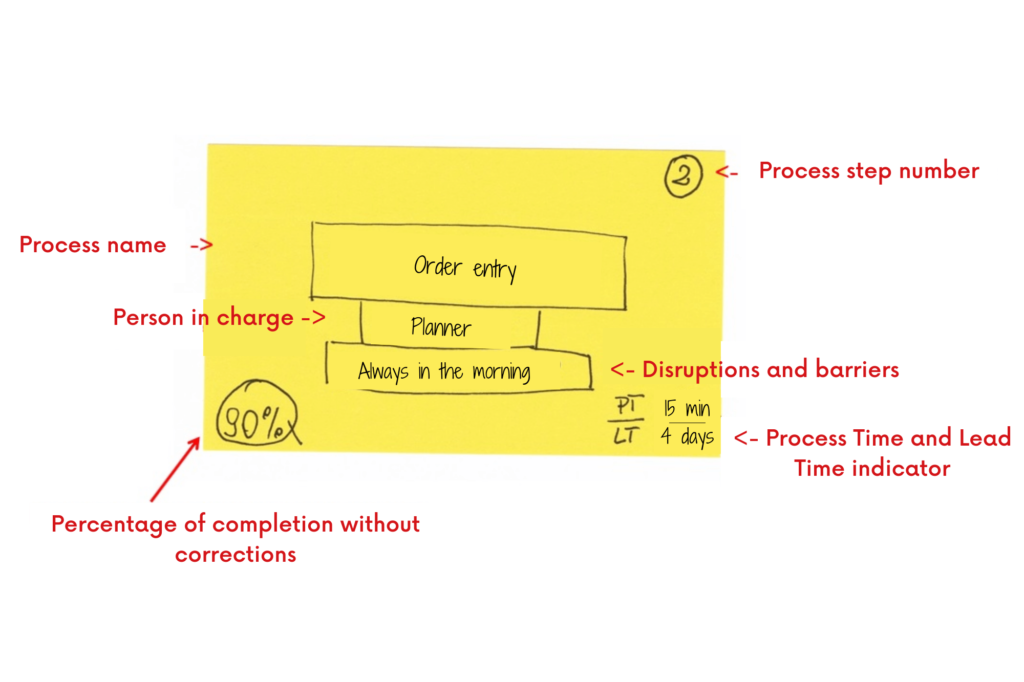
Define the basic process steps. Use yellow sticky notes, which can be easily rearranged. Often when we start analyzing a process, we forget about some steps that we add later. Yellow sticky notes are the best tool for this.
Fill in the fields under the process descriptions. Describe how many people are involved in each stage of the process, what they need, how much time each step takes, what problems occur, what the quality is like, what the KPIs are.

5 Draw the flow of people and material
6 Draw the flow of information – where and when does information come from?
7. Place operations on a timeline.

Benefits
- Each step of the process described is made visible and analysed
- Human resources, material resources, delays and customer lead times are analysed
- The vision created for the future clearly states how to implement process improvements
- The tool compares the actual state with the ideal state 1:1
- Helps to understand and see the flow of people, machines, information
Recommended book: “Learn to see” by authors Mike Rother and John Shook
We welcome your cooperation


