
Are you wondering why the time to deliver a product to a customer is getting longer? Delays and complaints are increasing, and you don’t know how to prevent it? Problems have arisen with the flow of material or information, and you want to eliminate them? Use the basic tool of the Lean Management concept, VSM, or value stream mapping, and find the cause of the problem, not just its manifestation.
Spis treści
- What is Value Stream Mapping
- Current state map
- Future state map
- Symbols used in Value Stream Mapping
- Steps of creating Value Stream Map
- Benefits of using VSM
- Summary
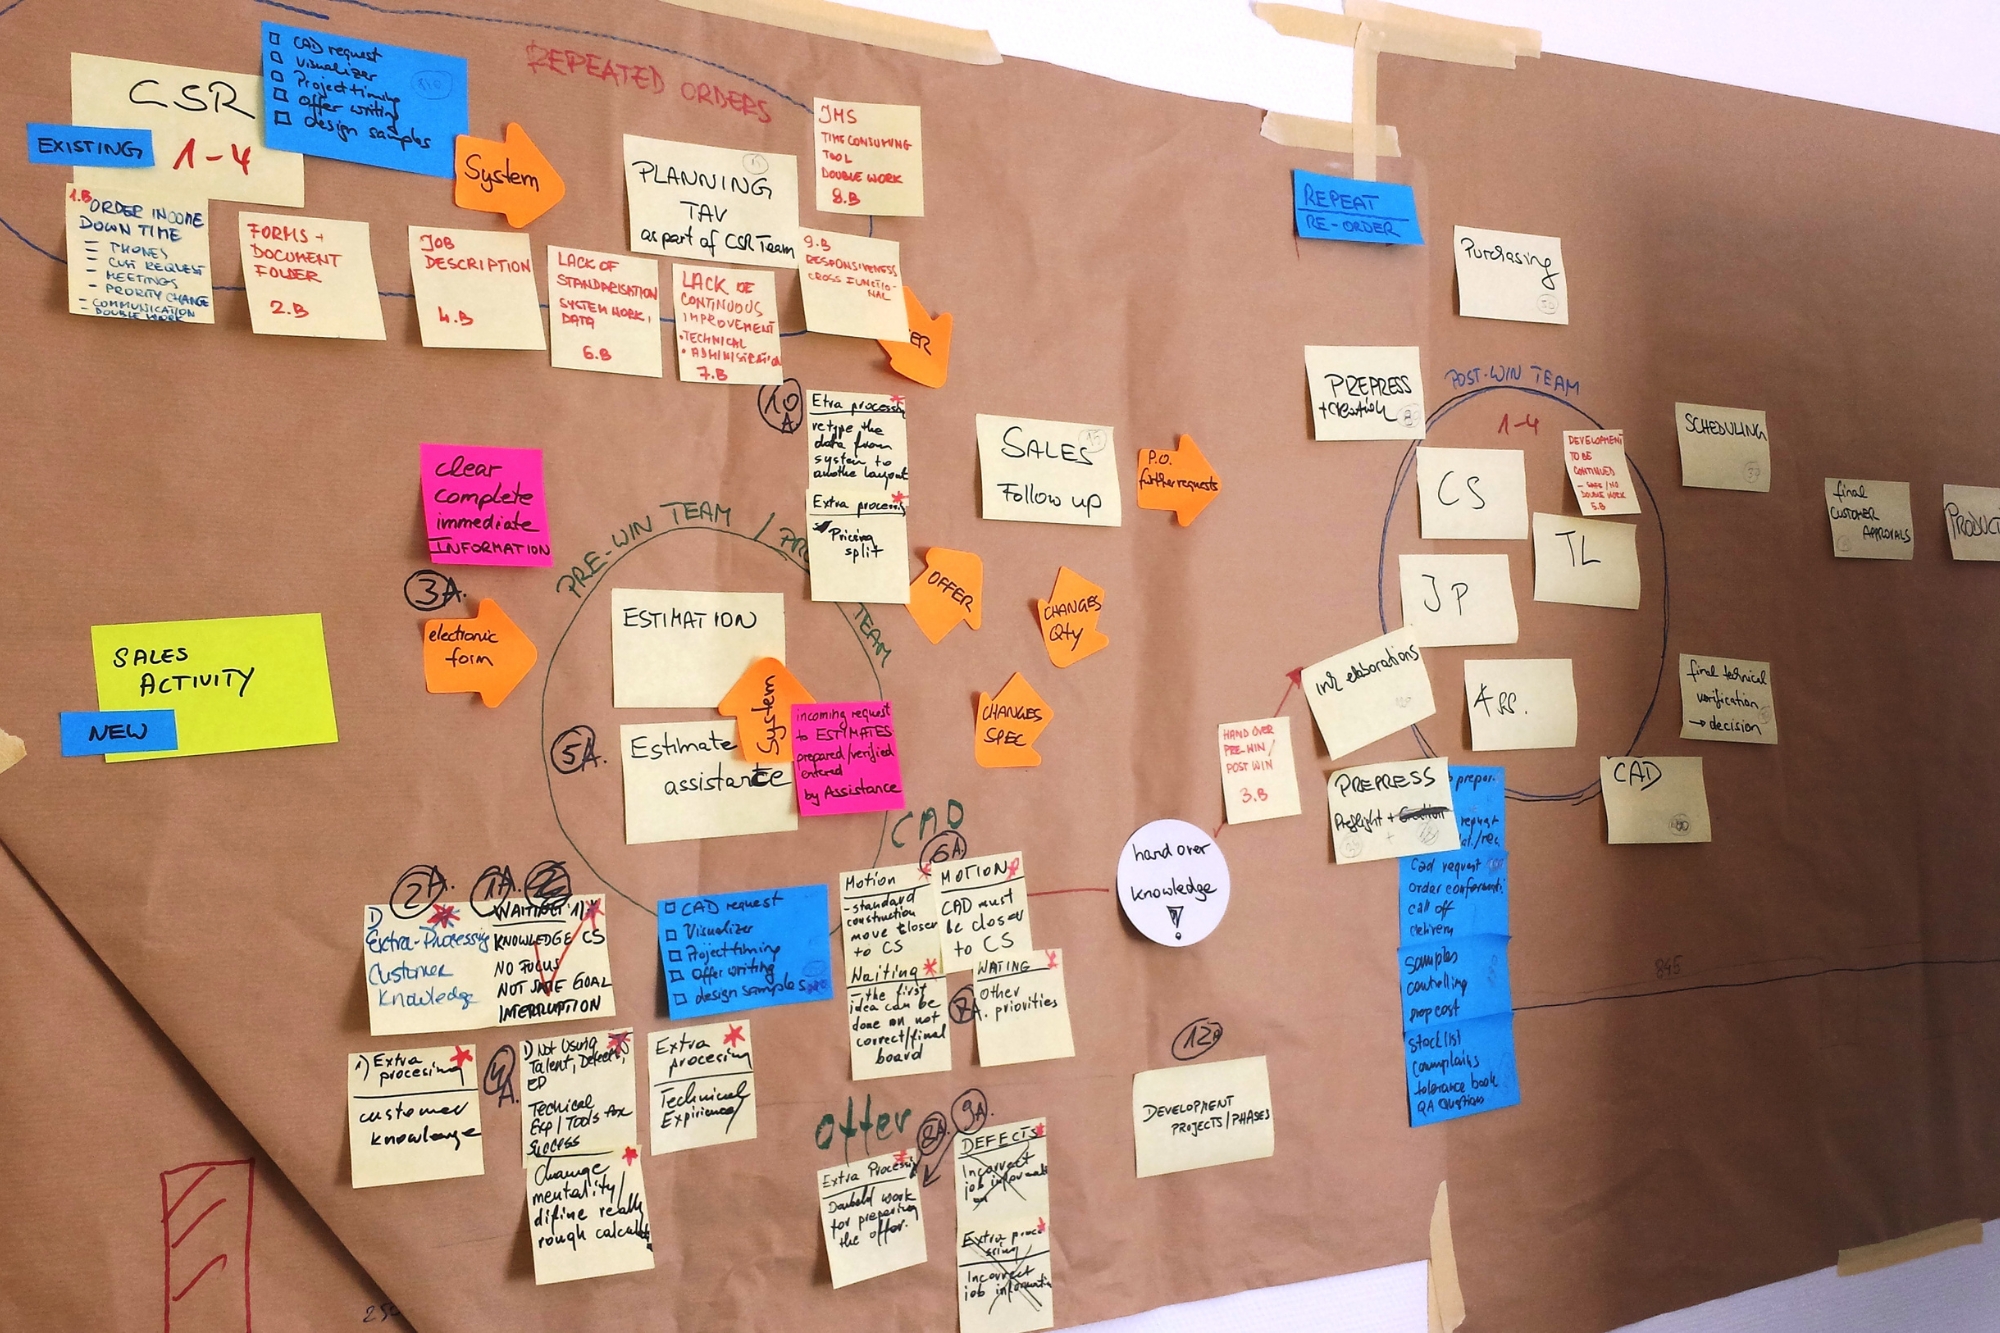
1. What is Value Stream Mapping
VSM (from Value Stream Mapping) is a LEAN tool that allows, graphically, to visualize and analyze all processes in a company, both production and auxiliary/support processes. It allows you to trace the flow of orders, materials, information and other process elements through the company, with the goal of producing the final product, in short, what the customer expects and pays for.
Value stream mapping allows you to quickly and clearly identify a lot of information necessary for the functioning of the enterprise, such as:
- the organization of individual processes,
- value added in whole processes and in parts of processes,
- muda, i.e. the opposite of added value, i.e. losses, waste occurring in processes,
- frequency of information flow and its type (input information, i.e., flowing into the process, and output information – flowing out of the process),
- the tact of individual processes, time and material buffers, and
- human resources involved in the processes.
This tool makes it possible to eliminate unnecessary activities in the process, i.e., those that do not add value, as well as to adjust the process to the specifics of customer orders. The key parameter is the tact, which determines the execution time of subsequent process steps, and is derived precisely from customer demand.
2. Current state map
The essence of value stream mapping consists of 3 elements – diagnosis of the current state, building a picture of the future state and creating a plan for implementing improvements. Creating a map of the current state starts with selecting the process to be analyzed, then defining its beginning and end. You can then move on to building a map of activities in the process, resulting in a current state map.
The current state map represents the process as it actually is, along with its flaws. In order to eliminate them, a map of the future state, or ideal state, is created.
3. Future state map
This step involves a thorough analysis of the current state map to identify non-value-adding activities, waste, delays and, in turn, improving them or eliminating them altogether, resulting in a new map of the same process. It contains the activities necessary to implement the proposed improvements. The creation of a new map continues until the process is feasible, while consisting only of value-adding (VA – Value Added) or non-value adding – but necessary (NNVA – Necessary but Non Value Added) activities. This is what the future/ideal state map will be.
However, it is worth remembering that the future state map is only a picture of how the process should go. In order to move from the current state to the ideal state, a plan for implementing improvements must be developed to then move to process improvement.
4. Symbols used in Value Stream Mapping
The symbols are intended to map the most important elements of the value stream map, including customer/supplier, transportation, process data, among others. The table below shows the most important ones.
| Symbol | Description |
 | Customer/Supplier/Subcontractor |
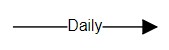
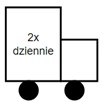 | External transportation by road, along with an indication of the frequency of deliveries (interchangeably the icon for aircraft – air transportation or ship – sea transportation) |
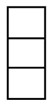
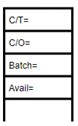 | Data box |
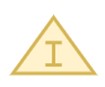 | Inventory (the place where the inventory is collected) |
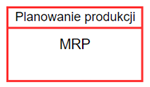 | Process box |
 | Safety stocks |
 | Supermarket (the place where products are taken from) |
 | Information flow |
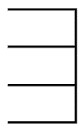
 | Timeline with Process Time (duration of activities) and Lead Time (duration + wait + delays) |
5. Steps of creating Value Stream Map
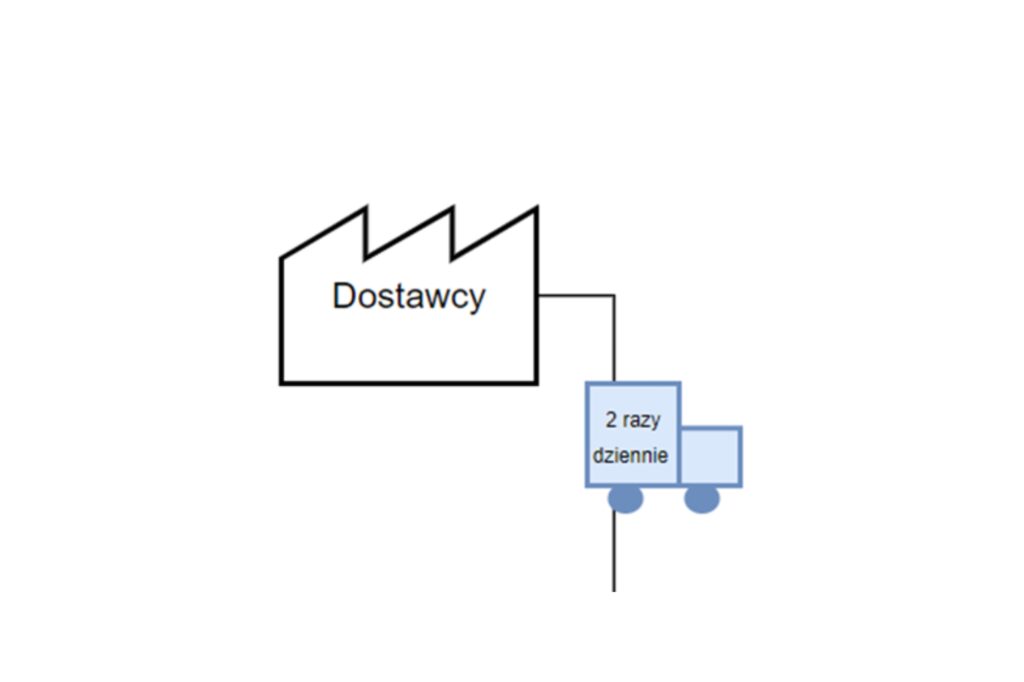
Step I – Customer
This is the first and most important stage of value stream mapping. The process always begins as well as ends with the customer. Mostly, the customer icon is introduced in the upper right corner of the map. Then describe his/her need for the company’s products/services.
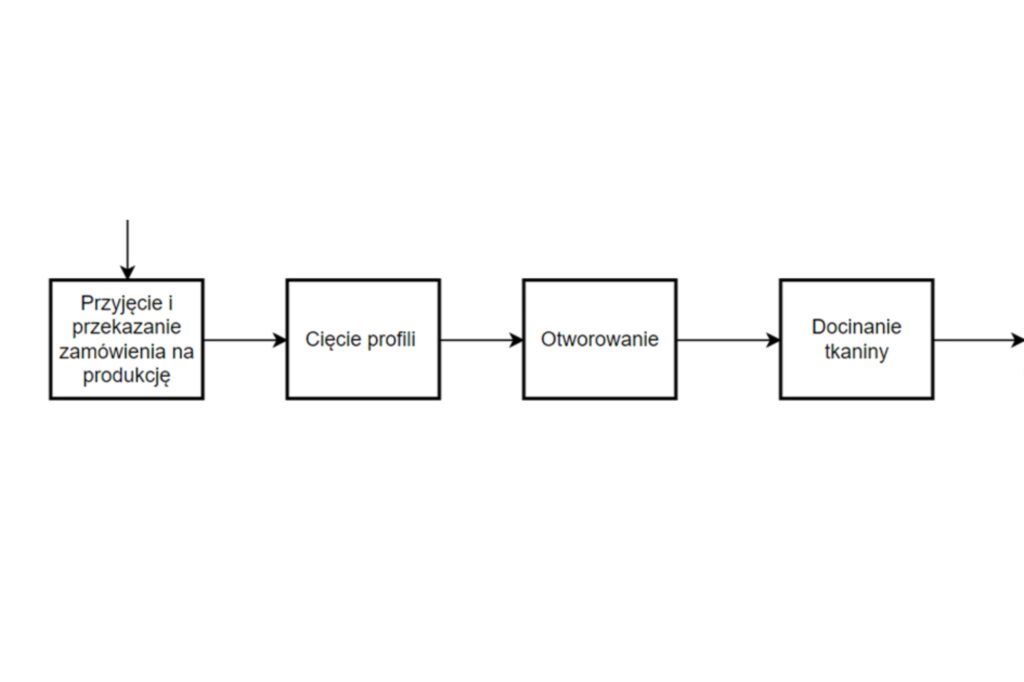
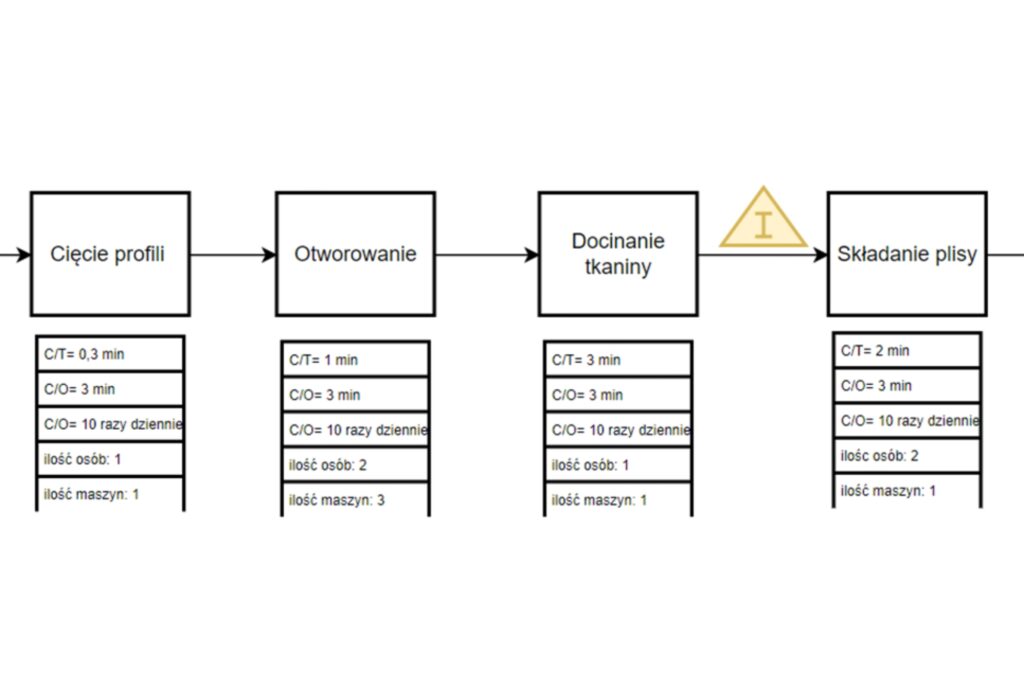
Step II – Steps of the process
The second stage involves marking the main elements/activities of the process that must take place in order for the product/service to be realized and delivered to the customer.
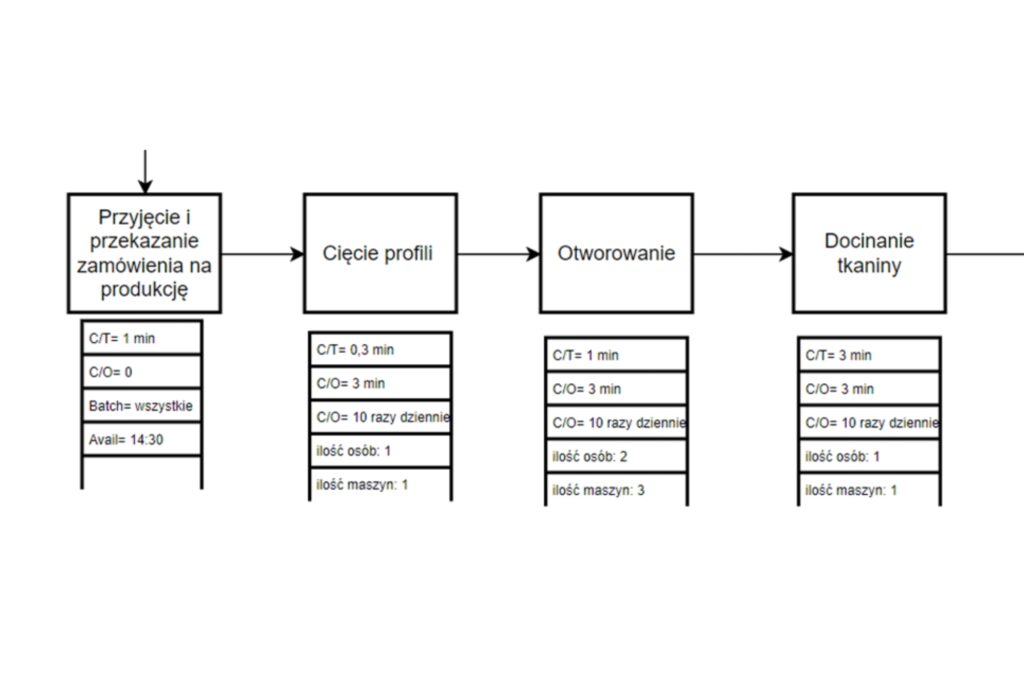
Step III – Process data
In the next stage, the so-called data box, or process data, must be filled in. This is a key stage due to the diagnosis of bottlenecks and waste in the process. The basic data that should be included here include:
- FTE – the number of employees involved in each process step,
- Cycle Time – the processing time of a unit,
- RFT – percentage of cases passed to the next process step without defects,
- Batch Size – how many units fall into the process at one time,
- Up Time – the percentage of time a worker and/or machine is in a productive state (e.g., ignoring worker interruptions).
Step IV – Inventory
Next, proceed to mark the locations where inventory appears.
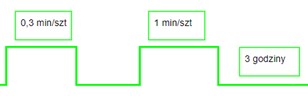
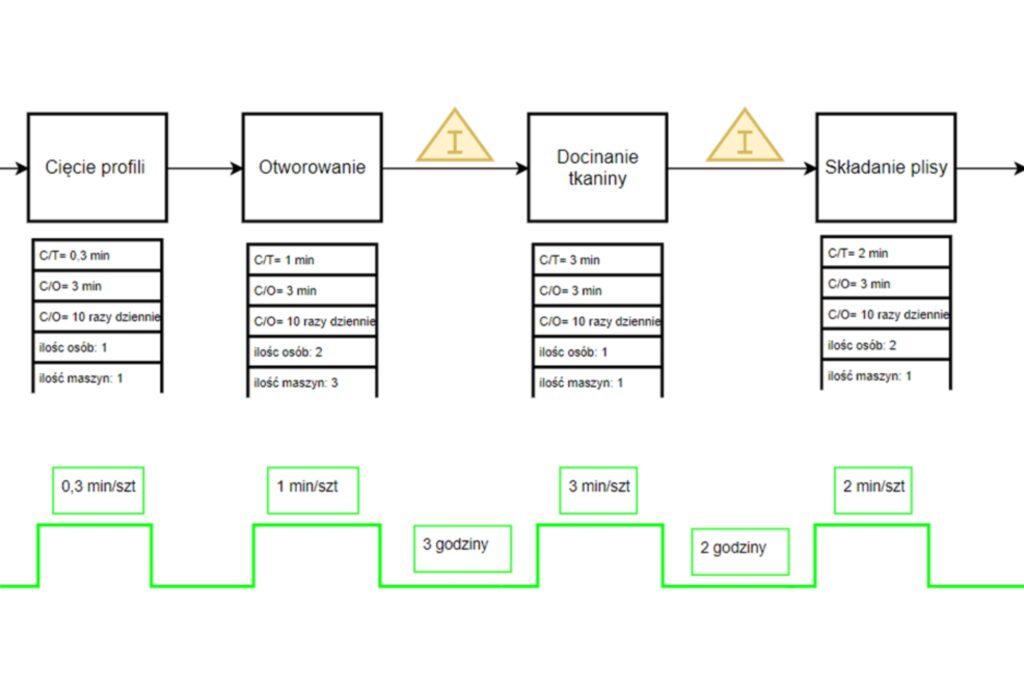
Step V – Timeline
The next step is the timeline, where you should mark the duration of the activity and the downtime between process steps. Under the process step, enter the cycle time, i.e. the duration of the step, while between steps – the duration of downtime, delays, waiting, if any.
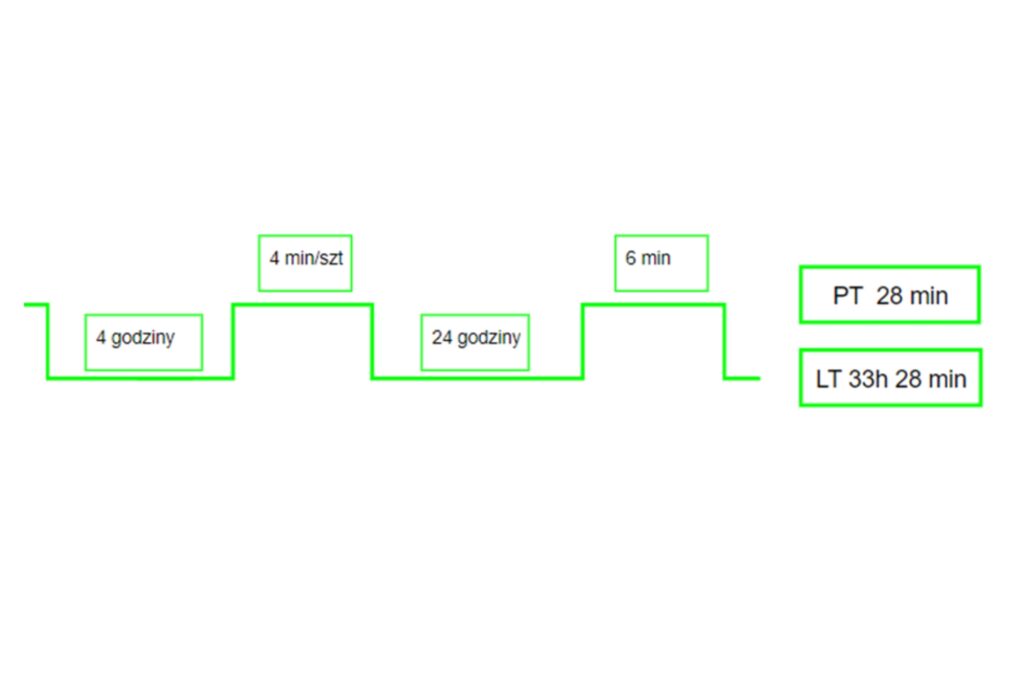
Step VI – Process Time and Lead Time
The last step is to calculate the process time, or Process Time, by adding up the duration of successive activities in the process, and Lead Time, which is the sum of the cycle time along with the sum of downtime and delays.
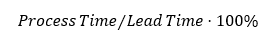
When you divide Process Time by Lead Time, you get an indication of how much of the total process is taken up by the activities that are really important to the customer.
6. Benefits of using VSM
Implementing a LEAN tool like value stream mapping has many advantages, including:
- VSM is easy to use, it allows all employees to understand the process flow, even those who are not associated with the process (every step of the process is illustrated and analyzed),
- contains all information about individual processes (human resources, materials, execution times),
- gives a picture of losses/delays/wastes occurring in the process, and helps identify their source,
- reflects the flow of information, human resources, material, and the connections between them, thus allowing to better understand it,
- enables identification of non-value-adding activities,
- compares the actual state with the ideal state 1:1,
- provides a plan for implementing improvements, supports management of improvement projects.
7. Summary
Value Stream Mapping is a great tool that will show you how much percentage of time is spent on activities that bring real value to the customer, and how much percentage of time is consumed by ordinary waste. This will be the basis for making changes to reduce the time it takes to deliver a product to the customer, reduce delays and complaints, and improve the flow of information, or materials.
If you want to learn more about stream mapping, map processes in your company but need help, contact us. We will provide training at your company and help you develop and implement a plan to improve your process and eliminate waste.